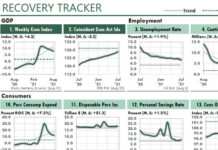
Three Charts Showing Covid-19’s Economic Damage
The following Excel figure shows three indicators of the US economy.Chart 1 measures the number of new unemployment claims during the past week as...
The First Excel Dashboard Report
The Excel dashboard below is from the first-ever package of dashboard reports, which I created to show Excel's power to a client back then....
You Usually Don’t Need to Select an Object in Excel VBA
An Excel VBA user asked in a forum recently how to select a sheet in VBA when the sheet name is stored as a...
What’s a ‘Deprecated’ Function in Excel?
Wikipedia tells us that deprecation is a status applied to a computer software feature, characteristic, or practice indicating it should be avoided, typically because of being superseded.
Each new generation of...
What the Heck is an Excel Database?
You can raise your Excel productivity significantly and slash your Excel errors—if you keep your data in an Excel database.
Microsoft, Oracle, IBM, and others...
Weekly Dashboard Reporting with Excel
"I work for a small (private) company whose owners have requested WEEKLY dashboards on various aspects of the business. Do you have a sample...
Weekly & Monthly Top-Ten Activity Reports
When one of my readers, Chris Helfrecht, sent the two sample Excel dashboards below, he wrote that he tried to follow my methods for...
Using Excel XY (Scatter) Charts for Stock Analysis with HLOC Plots
One way to improve your abilities in Excel is to improve your understanding of the kinds of solutions Excel can generate when you use—or...
Use VBA Functions to Return Excel Document Properties
"I would like to add a small formula-driven reference in my Excel worksheets that: (1) Automatically notes the original author/user (or last modifier) of...
Use this Excel ‘Cash Flow Balance Sheet’ to See Sources & Uses of Funds...
For most businesses, cash flow is more important than profits and losses.
The reason is clear. A profitable company with negative cash flows may not...


